
EDUCATION
Click each offering to learn more:
LONI Software Training
LONI develops a diverse array of modeling, analysis and visualization software and provides user guides, forums and training workshops demonstrating the use of these computational resources to solve specific biomedical imaging problems. Software training is available for researchers who use LONI software. Visit our calendar on the News and Events page for information about upcoming scheduled training. On-site trainings are held in the LONI DIVE theatre. Off-site trainings can be arranged at your institution.LONI Pipeline Training
The LONI Pipeline provides a graphical framework for development, maintenance and dissemination of neuroimaging data-analysis protocols. The Pipeline environment offers a scalable infrastructure for graphical integration of diverse, complex and heterogeneous software. The training course covers how to employ any of the available Pipeline library modules and workflows. Attendees will get acquainted with the Pipeline interface and learn how to describe their own modules and create processing workflows, including a hands-on demonstration of segmentation, shape analysis and cortical thickness workflows.LONI Pipeline
LONI Research Protocols
LONI provides trainees with access to a diverse array of neuroimaging research protocols. These protocols illustrate the functionality and utilization of heterogeneous datasets, a number of validated methods and tools for data analysis, as well as web-services for managing brain imaging data.LONI Resource (LONIR) supports neuroimaging researchers investigating brain structure, function and physiology in health and disease using comprehensive imaging analysis. The goal of the Resource is to develop a collaborative environment equipped with the necessary tools for discovery in brain imaging research. The algorithms and tools developed by LONIR are made available to the neuroscience research community. In doing so, LONIR hopes to foster research relationships that will disseminate new information and train investigators in the use of new techniques. LONI Resource is operated by the Laboratory of Neuro Imaging (LONI) at USC and funded by the P41 Biomedical Technology Resource Center award. This NIH grant is governed by the National Institute of Biomedical Imaging and Bioengineering (NIBIB).
LONI ResourceLONI Instructional Web
The LONI Instructional Web illustrates concepts behind different research methods and neuroimaging techniques. This online tutorial was developed to train medical students and neuroanatomists. It is accessible to the public.Techniques in Neuroimaging
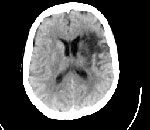
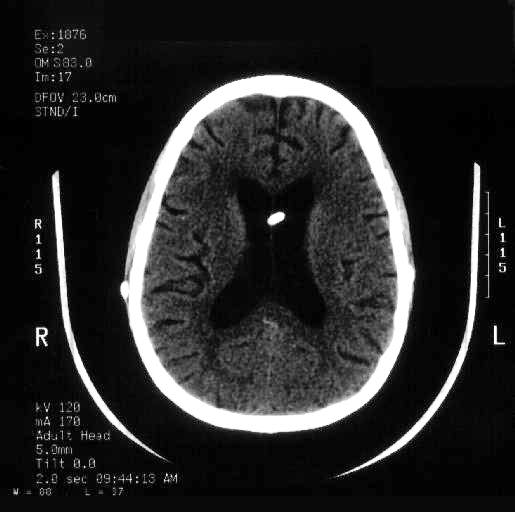
Information about CT, MRI and SPECT/PET image types along with tabluation of tissue image characteristics.


Read more about MRI physics
PRINCIPLE
To understand the fMRI method, investigators should be familiar with the physical principles of magnetic resonance that determine its signal characteristics, and through which it is possible to form images. In overview the process is as follows:- The subject is first placed into a strong and homogeneous magnetic field. Various atomic nuclei, particularly the proton nucleus of the hydrogen atom (from here, we will consider only the proton), align themselves with this field and reach a thermal equilibrium. The subject is thereby “magnetized.”
- The proton nuclei precess about the applied field at a characteristic frequency, but at a random phase (or orientation) with respect to one another.
- Application of a brief radio frequency (RF) electromagnetic pulse disturbs the equilibrium and introduces a transient phase coherence to the nuclear magnetization that can, in turn, be detected as a radio signal and formed into an image.
MR SIGNAL FORMATION
The proton nuclei of the hydrogen atom possess a small magnetic moment. When placed within a magnetic field, a torque will be exerted upon them, resulting in a slight energetic advantage of one orientation (parallel to the field) over another (the anti-parallel orientation). Over time, random atomic collisions and other perturbations allow the complete system to reach a magnetic and thermal equilibrium with an excess of protons aligned with the magnetic field. The combined alignment of all of these protons results in a net magnetic moment; a subject placed within a magnetic field thus becomes “magnetized.”
Figure 1
Figure 2
Figure 3
(Left) The hydrogen proton possesses the quantum property of “spin” or angular momentum, and has a small magnetic dipole moment. When placed in a magnetic field, a torque is exerted on the particle, causing it to precess about the applied field.
Figure 2: Vector description of proton magnetization
The rotating magnetic moment of the proton can be decomposed into a longitudinal component, along the applied magnetic field, and a transverse component orthogonal to it and rotating (precessing) about it.
Figure 3: Spontaneous Decay of Transverse Magnetization (Signal)
| MR-T1 |
MR-T2 |
Xray-CT2 |
|
|---|---|---|---|
| Dense bone | dark | dark | bright |
| Air | dark | dark | dark |
| Fat | bright | bright | dark |
| Water | dark | bright | dark |
| Brain | "anatomic"3 | intermediate | intermediate |
- Bright means high signal intensity, dark means low, and interm. means intermediate.
- Bright means high density/high attenuation of x-rays, dark means low.
- Grey matter appears grey, white matter white.
| MR-T1 | MR-T2 | Xray-CT2 | Enhancement1 | |
|---|---|---|---|---|
| Infarct | sub-acute | |||
| Bleed | no | |||
| Tumor | ||||
| MS plaque | dark4 | acute |
- Blood brain barrier leak. For MR, gadolinium; for CT, iodinated contrast material.
- Unless very fresh or very old.
- Unless calcified.
- Often isodense.
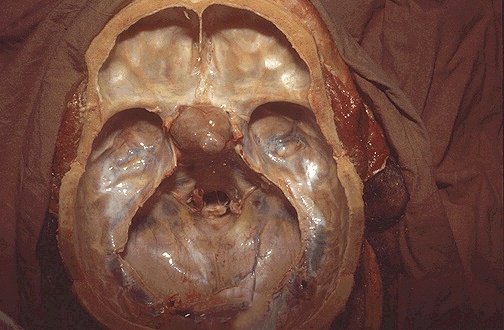
Ventricles and Cisterns
Can you identify the ventricles and cisterns that appear in this image?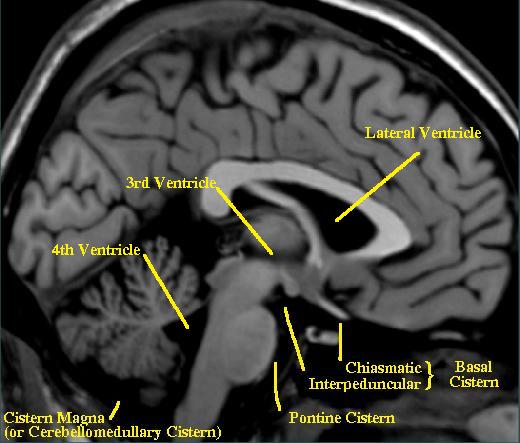


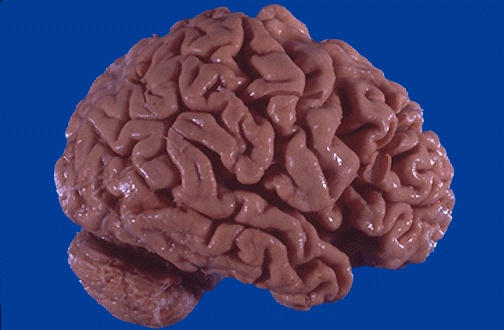
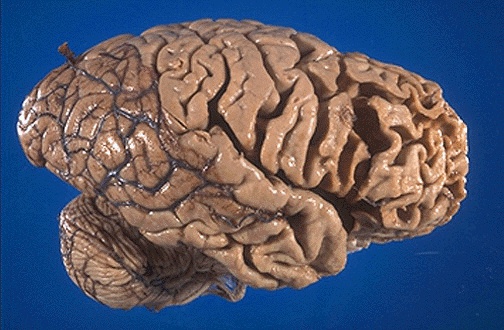
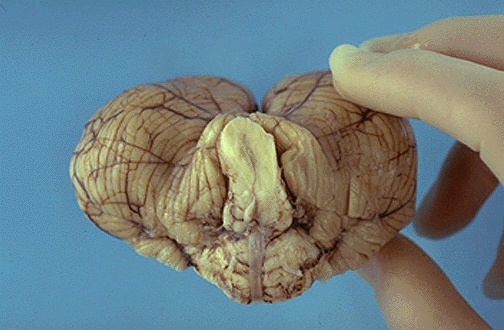
Telencephalon
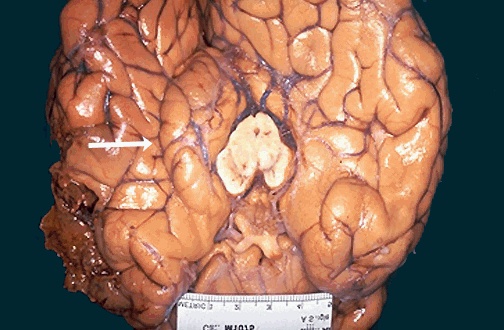
Diencephalon and Basal Ganglia
Brainstem
For multiple brainstem models and diagrams please see the Digital Anatomist site at Washington University.


Cerebellum
What is the function of the cerebellum? The cerebellum is involved in motor pathways, and is often associated with coordinated movement. The Gao et. al. article indicates that the cerebellum also is involved in sensory pathways. What else? There does exists evidence for the involvement of the cerebellum in higher cognitive function. Middleton, F.A., and Strick, P.L. (1994) "Anatomical evidence for Cerebellar and Basal Ganglia Involvement in Higher Cognitive Function" Science 266:458-461. Abstract available.
Abstract
The possibility that neurons in the basal ganglia and cerebellum innervate areasof the cerebral cortex that are invloved in cognitive function has been a controversial subject. Here, retrograde tansneuronal transport of herpes simplex virus type 1(HSV1) was used to identify subcortical neurons that project via the thalamus to area 46 of the primate prefrontal cortex. This cortical area is known to be involved in spatial working memory. Many neurons in restricted regions of the dentate nucleus of the cerebellum and in the internal segment of the globus pallidus were labeled by transneuronal transport of virus from area 46. The location of these neurons was different from those labeled after HSV1 transport from motor areas of the cerebral cortex. These observations define an anatomical substrate for the involvement of basal ganglia and cerebellar output in higher cognitive function.


Top Figure
The possibility that neurons in the basal ganglia and cerebellum innervate areasof the cerebral cortex that are invloved in cognitive function has been a controversial subject. Here, retrograde tansneuronal transport of herpes simplex virus type 1(HSV1) was used to identify subcortical neurons that project via the thalamus to area 46 of the primate prefrontal cortex. This cortical area is known to be involved in spatial working memory. Many neurons in restricted regions of the dentate nucleus of the cerebellum and in the internal segment of the globus pallidus were labeled by transneuronal transport of virus from area 46. The location of these neurons was different from those labeled after HSV1 transport from motor areas of the cerebral cortex. These observations define an anatomical substrate for the involvement of basal ganglia and cerebellar output in higher cognitive function.
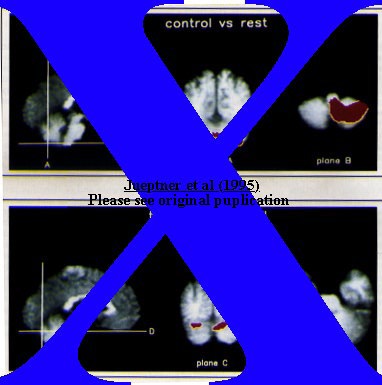
Bottom Figure
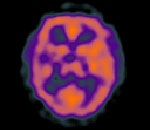
Increases of regional cerebral blood flow in the timing task (timing versus control). Subjects had to estimate time differences by comparing a test interval with a standard interval. The increases of blood flow occurred in the superior part of the cerebellar hemispheres bilaterally and the cerebellar vermis. The left sides of planes C and D correspond to the left side of the brain.
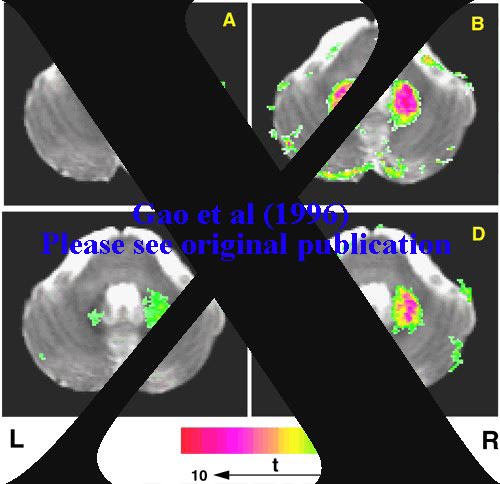
Functional MRI (color) superimposed on the anatomical MRI (gray) showing dentate activations (18) for each task: (A) Grasp Objects, (B) Grasped Objects Discrimination, (C) Cutaneous Stimulation, and (D) Cutaneous Discrimination. The dentate nuclei are the two dark crescent-shaped structures symmetrically-opposed about the midline of the cerebellum. Both functional and anatomical images were co-registered for each task by performing rotation, translation, and scaling on each individual subject's images and then averaging the coregistered images across subjects. A Student's group t-test was performed on these coregistered images for each task comparing task-induced changes relative to rest. Brain activation was detected by use of a threshold defined by both a t-value of 2.5 and a cluster of 5 adjacent pixels. The above-threshold sites represent activations statistically significant to P < 0.05 relative to the whole cerebellar plane sampled. The activations are displayed on a color scale ranging from a t-value of 2.5 (green) to 10.0 (red). R and L are right and left sides of the brain respectively.
Neuroimaging Techniques Review
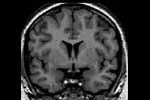
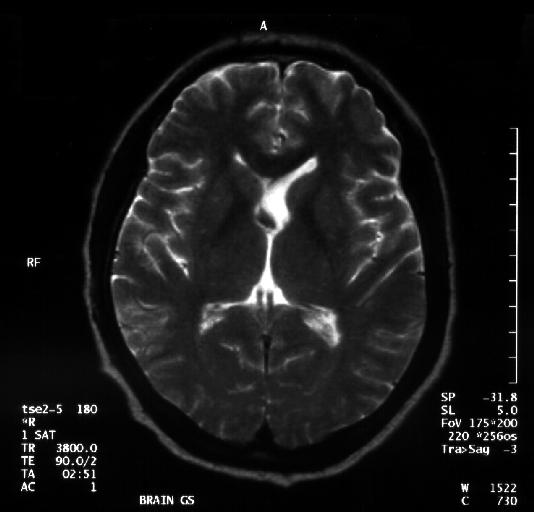
Review the Neuro Imaging Techniques. In particular, since MRI has become such an important tool used in medicine review the tissue image characteristics as seen by T1 and T2 scans. Can you identify a T2 scan when you see one?
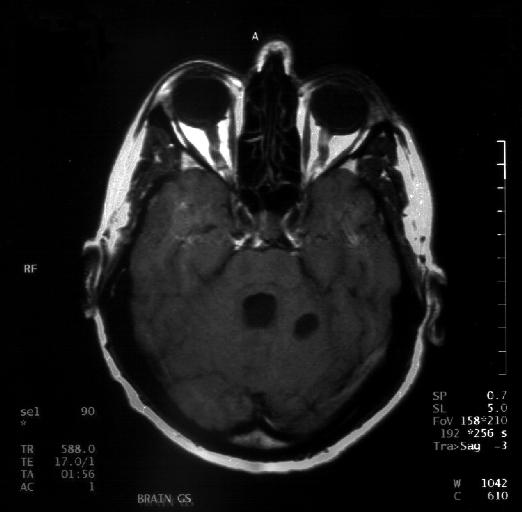
This is a multiple slice tour of the Diencephalon as seen by T2 weighted MRI's. (adopted from Harvard's whole brain atlas) On the following sections identify the mamillary bodies, red nucleus, substantia nigra, pineal gland, pituitary gland, sphenoid sinus, infundibulum, suprasellar cistern, cerebral peduncle, hypothalamus, posterior commisure, thalamus and fornix.
Additional MRI's
The following are T1 Coronal MRI's.

The following are T1 Sagittal MRI's.

Brain Trivia